Following my last post I have had some time to analyse a few more bat recordings and consider how to streamline my work flow.
Until recently, I've been carrying out all file operations using Audacity.
But there are a few things I can do via the command line, which I've pulled together in a Gambas GUI program.
The result is that I can work through an over-night recording session much quicker than before. I am also gaining a bit of experience in recognising the waveforms for our common bats (...and birds).
workflow
These are the steps I have identified:-
- Process WAV files; with all real-time WAV recordings in a single directory, remix them down from 2 channels to 1.
- Create spectrogram files; use SoX (Sound eXchange) to produce a visual image for each recording.
- Create an audio file; use SoX to create an MP3 file which plays at x10 speed of the original (frequencies reduced by one tenth).
- View spectrograms; delete any files which are empty or just contain junk.
- Use Audacity; load any files of interest into Audacity.
In step 1 the original WAV file contains a real-time recording and a second channel which I'm not using (hence the remix to a single channel). Other filtering/processing could be done at this stage (e.g. normalisation, noise reduction & so on).
The program creates audio and image files using the same basic name as the WAV file. This makes it easier to manage and/or delete each set of 3 related files.
 |
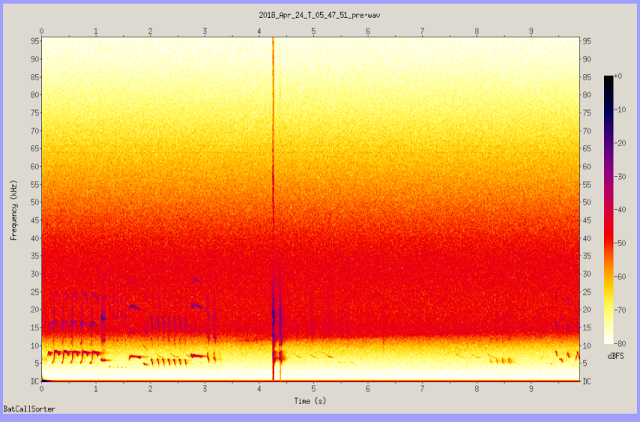
| call sequence for a common pipistrelle bat. The long vertical lines are due to overload (i.e. the bat flew too close to mic). |
frequency response & the spectrogram
Apart from the actual bat call, the spectrogram also reveals something about the systems frequency response. If we assume that the noise level is uniform across the frequency spectrum, then the colour of the spectrogram would be uniform if the system had a flat frequency response.
In practice, at the lower frequencies the colour changes from red to yellow to white. This is to be expected because my bat detector includes a band-pass filter. At low frequencies the response starts to fall off below 15kHz.
In fact I've added another CR filter to reduce the low frequency response in addition to the original filter components in Chris Eve's circuit. This is an attempt to reduce bird recordings; in the evenings its generally the blackbirds, and in the mornings it seems to be the robins that are the 'problem'.
At the high frequency end the response also drops off, but this time more gradually. This is to be expected from my checks on the Wolfson audio card (figures taken in an earlier post) and also due to the limitations of the electret microphone.
This file was captured with the microphone in the same room as the Pi connected to an LCD monitor...
 |
| no bat calls, just constant frequency noise |
I suspect radiation from power supplies and the LCD are the most likely sources of this frequency banding.
a few more recordings
This recording looks like a noctule bat...
 |
| Once again the long vertical lines are caused by audio over-load. |
...with a feeding buzz towards the end.
Not really sure what this is...
...but probably a noctule bat.
I think this one is due to one or more early morning birds...
And this is another pipistrelle call sequence which includes the feeding buzz...
bat camera
Although I did build an iR bat camera I don't plan to take it any further. The range when using my iR led cluster was not great, which is probably not surprising. The leds would probably give a range of 20m if used with a sensitive surveillance camera, but the Pi camera is not so sensitive, and will probably give only 10% of that range.


No comments:
Post a Comment